Engagement rate is one of the most telling indicators of whether your target group responds to your content on social media.
And while many marketers tend to avoid paying for vanity metrics, such as impressions or reach, engagement metrics are more attractive. When you see the number of likes, shares, or comments on the content you’re posting, you have tangible results of your efforts.As a TOFU metric, the engagement rate will show you how effective you are at raising brand awareness by successfully getting people to react to your content. A high engagement rate typically indicates that the content you’re posting is relevant, helpful, and valuable to your followers.
What is engagement rate, and how do you calculate it?
Engagement rate (ER) is a metric that measures the level of interaction between an audience and content posted on social media platforms.
Pretend you’re hosting a party. You’ve invited 10 of your friends, decorated your home and set a table of delicious food. In this case, the ER would be the number of friends eating and enjoying the food you’ve prepared.
The more people eating and enjoying the food you prepared, the higher your engagement rate.
The same applies to social media. Likes and comments show that users are “eating and enjoying your food” and engaging with your post.
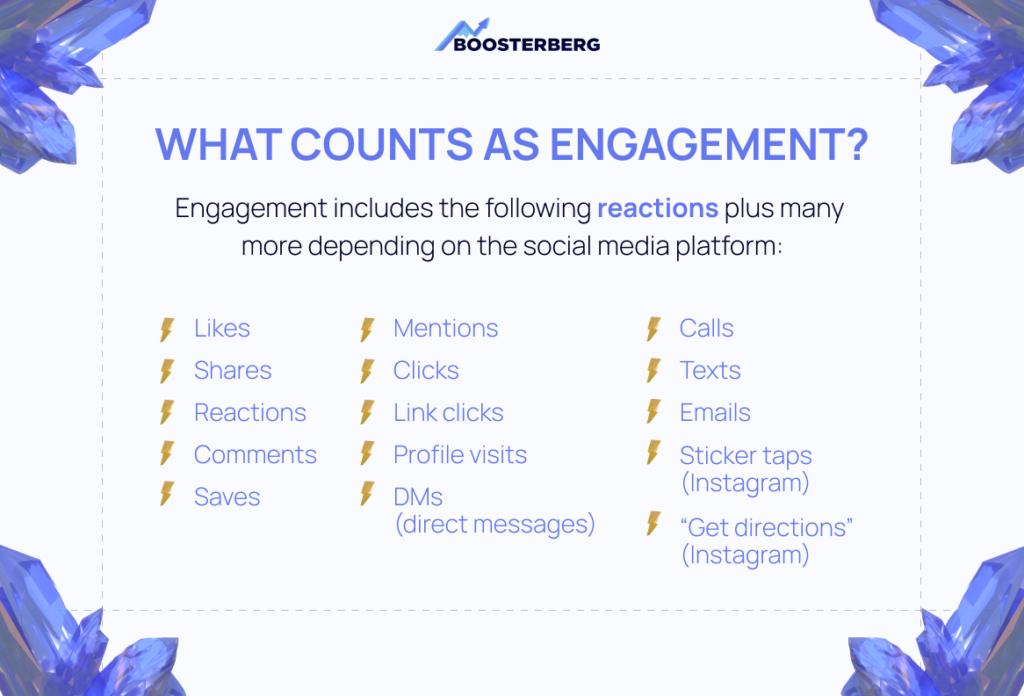
HOW TO CALCULATE ER
To calculate the ER, divide the total number of interactions (likes, comments, shares, etc.) by the number of followers or subscribers, and multiply the result by 100.
A social media account with 1,000 followers and 100 likes, comments, and shares on a post would have a 10% engagement rate (100 divided by 1,000, multiplied by 100).
Achieving that level of engagement would be a cause for celebration. However, here’s a reality check. A recent study by socialinsider.io found that Facebook has an average ER of 0.15%. Instagram has a slightly higher engagement rate of 0.60%.
You can use different formulas to calculate your social media engagement rate, based on what part of your strategy you want to measure.
Engagement rate per post
ER of a single post:
(Total number of interactions on a specific post / Total number of followers) * 100
If you have 1,000 followers and you receive 40 likes, and ten comments on the post, your engagement rate on this post would be 5%.
The average ER by post:
Total engagement rate per each post you want to average / Total number of posts.
For example,
Post A (2.0%) + Post B (1.5%) + Post C (3.1%) + Post D (0.9%) / 4 = 1.87%
Keeping track of your engagement rate per post can help you determine what type of content is most popular with your followers and how your content strategy is performing. You can optimize your social media strategy by focusing on the content your target audience responds to.
However, calculating ER posts can be time-consuming since you may have many posts to analyze. As a result, you won’t be able to optimize your content strategy immediately. Posts that go viral for reasons unrelated to their quality may also affect your engagement rate per post, exaggerating it and misleading you in return.
Engagement rate per follower
By calculating ER per follower, you can gain insight into how engaged your followers are with your content. Over time, you can identify trends regarding how your audience reacts to your content by tracking ER per follower.
(Total number of interactions/Total number of followers) / Total number of posts * 100
If you have 1,000 followers, you’ve published 20 posts and received a total of 400 interactions across all of the posts (comments, likes, shares, etc.), your engagement rate per follower would be 2%.
The calculation of ER per follower assumes that all your followers are engaging with your content somehow, which is not true. Only a small percentage of your followers interact with your content, and others may never see it at all. Because of this, ER per follower does not accurately reflect your engagement rate. ER per follower can also be affected by fake and inactive followers.
Engagement rate per reach
We all know that our content doesn’t reach every one of our followers on social media. In light of this, you might consider including the number of users reached in your formula when calculating the engagement rate. Reach will tell you exactly how many of your followers saw your content, so in that case, you may get a more accurate ER.
First, you need to calculate the engagement rate by reach per a single post by using this formula:
Total number of interactions per post/reach per post * 100
For example, one of your posts got 20 likes, five comments, and five shares and reached 1000 people:
ERR = (40 / 1000) * 100 = 4%
Once you calculate the ERR (engagement rate by reach) for all of your posts, you can calculate the average ERR for your page/profile, by using the following formula:
Avg ERR = [ERR (Post 1) + ERR (Post 2) + … + ERR (Post N)] / N x 100
For example:
Avg ERR = (4% + 5.1% + 2.23% + 5.6%) / 4 = 4.23 %
Taking into account the number of actual viewers makes ERR more accurate in determining how your content impacts your audience. However, this formula may not always be accurate since reach is often estimated. Further, lower reach can skew your results because the lower the reach is in the formula, the higher your engagement rate can be. This can be misleading if you’re just following stats blindly.
Daily ER
You can calculate your daily ER to see how often your followers interact with your profile daily, rather than just counting how many of them react to each post.
To calculate it, use the following formula:
Daily ER = Total reactions to your account in a day / Total number of followers x 100
So if you received ten likes, three comments, and two shares in one day and you have 1,567 followers, your daily ER would be 15/1567 x 100 = 0.95%
By calculating your Daily ER, you can identify spikes or drops in engagement and adjust your strategy accordingly, and you can also identify trends. Your daily ER can, however, easily be affected by external factors beyond your control, such as major world events. This is because global events, such as holidays or political happenings, can cause a sudden influx of traffic or a sudden drop in engagement.
Engagement rate per impression
If you’re trying to figure out whether your ad campaigns are effective, adding the number of impressions to your engagement rate calculation formula can be helpful:
Impressions reflect the number of times a user has seen your content. One user may see your content multiple times, so the number of instances does not equal the number of users.
The formula is as follows:
ER impressions = Total reactions to a post / Total number of impressions x 100
If you have 25 reactions on your post and 15,000 impressions, your ER by impressions would be 25/15000 x 100 = 0.16%
It is important to note that ER per impression does not take into consideration the quality or relevance of engagements. The formula assumes that all impressions are equal, which they aren’t. Due to the nature of ads, it’s difficult to avoid having your content shown to users who are not in your target audience. You should therefore take engagement rates per impression with a grain of salt.
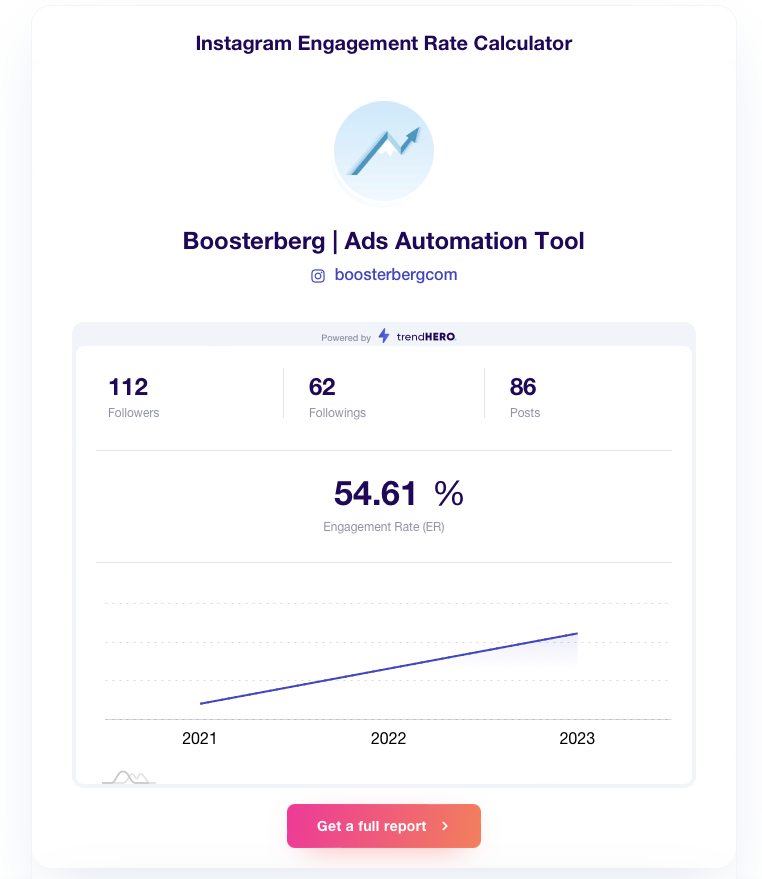
Online ER Calculators to try
* this Instagram engagement rate calculator by TrendHero.io, to discover your average ER on Instagram.
* a more universal and complex ER calculator by Hootsuite, where you can try out all the formulas we covered in the article.
What is the best way to calculate engagement?
The best method for calculating your engagement rate depends on what you are trying to achieve.
Before you start calculating:
1. Consider your goals and ask yourself: what do you want to measure and why? Would you like to measure the effectiveness of a single campaign, benchmark against competitors, or find out when your followers are most likely to react to what you post?
2. Decide which engagement metrics matter to you the most – shares, likes, or something else? Are you trying to get more comments on your posts? Choosing the right engagement metrics will help you get the ER that reflects what you want to measure.
3. Use the right formula based on your defined goals and chosen engagement metrics
4. After calculating the results, analyze them in light of your goals and objectives. Be careful not to blindly trust the numbers – 10 similar comments from one user are not the same as three relevant, valuable comments from three different users.
5. To get a more accurate picture of your success, combine ER with other metrics such as click-through rates, conversion rates, reach, and impressions.
If you’re looking to improve your engagement rate on social media and organic just isn’t cutting it anymore, consider investing in post engagement campaigns. Social media post engagement ads are an excellent tool for building brand awareness, educating your target audience, and lowering your overall cost per acquisition.
With Boosterberg, you can set up your post engagement campaigns in just a few clicks and continue creating high-quality content for your audience, while the tool deals with Meta’s Ads Manager and saves you tons valuable time along the way.