Managing social media ads can feel like juggling multiple balls at once. Beyond clicks and likes, understanding deeper metrics can make a world of difference. In fact, marketers who focus on the wrong metrics could waste up to 30% of their ad budget on ineffective campaigns. This article will explore five critical measures every marketer must track for a successful social ad campaign—often overlooked, yet vital for deeper insights into ad performance.
Many marketers share the frustration of not achieving the desired results despite putting in significant effort. You’re not alone. This article will provide practical tips and strategies to help you identify and track key metrics that go beyond surface-level engagement, ultimately simplifying your social ad campaigns.
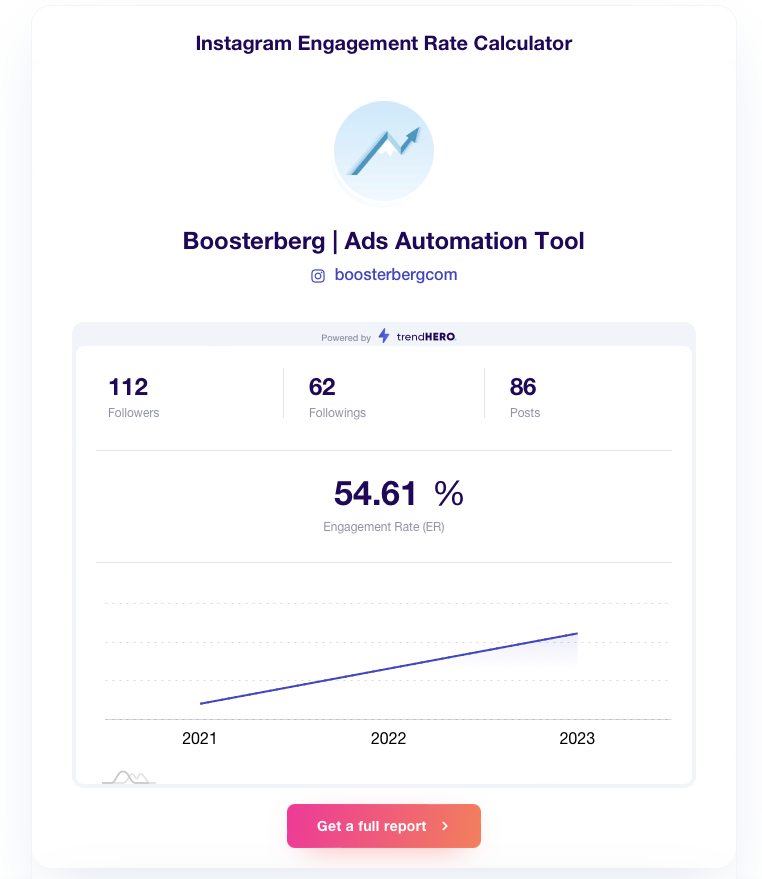
Engagement Rate by Reach is a crucial metric that helps you understand the quality of engagement relative to the number of people your ad reached. It’s a starting point for measuring the true impact of your content.
But be careful! Many marketers make the mistake of focusing solely on raw engagement numbers, like likes and comments, without considering the engagement ratio to the number of users reached.
Example: If an ad reached 1,000 people and received 150 engagements, the Engagement Rate by Reach is 15%. Ads with higher rates are more effective in engaging your audience.
While engagement is key, the financial side of your campaigns is just as important, which leads us to Cost Per Conversion.

Cost Per Conversion is essential for evaluating the financial efficiency of your campaigns. It tells you how much you’re spending to achieve a specific goal, such as a lead or sale.
Marketers often fall into the trap of focusing on clicks or reach while ignoring the actual conversion cost. Remember: higher clicks don’t always mean better conversion.
Example: If you spend $500 on an ad campaign and get 50 conversions, your Cost Per Conversion is $10. Focus on reducing this cost to improve profitability.
Next, let’s dive into the effectiveness of your video content with the Video Completion Rate.
Video Completion Rate measures how many viewers watched your video ad to the end. This metric indicates the effectiveness of your content in retaining viewer attention.
Be cautious! A high completion rate might not always translate to conversions, especially if the video doesn’t prompt clear next steps for users.
Example: If 800 out of 1,000 viewers watch your video ad to the end, your Video Completion Rate is 80%. Higher rates suggest more engaging content.
Now that we’ve covered video performance, let’s shift to how well your ads drive action with Click-Through Rate.
Click-Through Rate on Post Engagement Ads helps you understand how well your ad copy and visuals are prompting users to take action.
But beware! Many marketers make the mistake of optimizing solely for CTR. High click-through rates don’t mean much if those clicks don’t lead to conversions.
Example: If your ad had 10,000 impressions and 500 clicks, the CTR is 5%. Higher CTR indicates more compelling ad content.
Finally, we’ll look at the ultimate measure of ad efficiency: Return on Ad Spend.
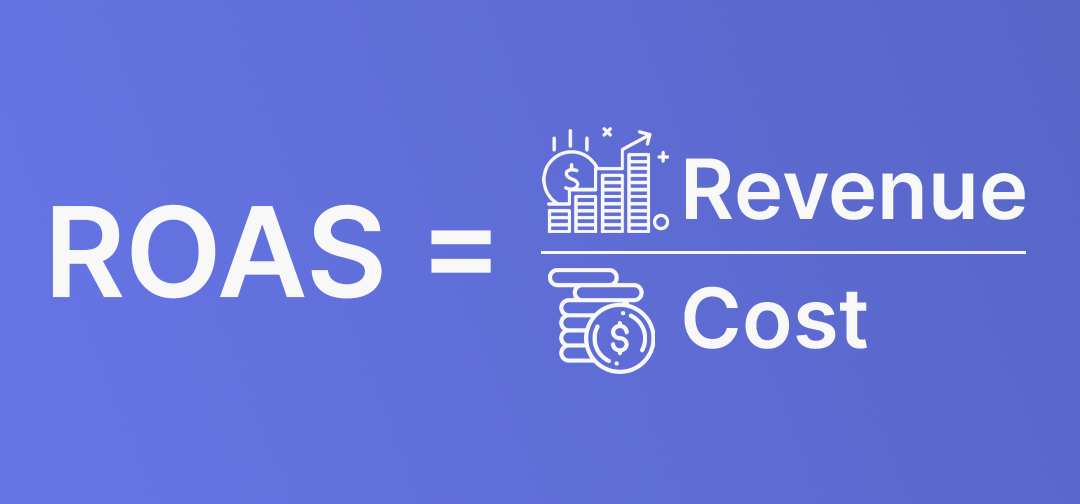
Return on Ad Spend is a key metric for evaluating the overall efficiency of your ad campaigns in generating revenue.
A common pitfall here is overlooking the ad spend of different platforms. Some campaigns may appear profitable but have hidden costs that skew your ROAS.
Example: If you spend $1,000 on an ad campaign and generate $5,000 in revenue, your ROAS is 5:1. A higher ROAS indicates a more successful ad campaign.

Tracking these often-overlooked metrics can provide deeper insights into your social ad campaigns, leading to better decision-making and improved outcomes. By focusing on these measures, you can enhance efficiency, increase ROI, and drive more meaningful engagement with your audience.
If managing these metrics feels overwhelming, consider using Boosterberg. It automates many of these tasks, optimizes performance, and allows you to focus on strategic and creative aspects. Simplify your ad management by trying Boosterberg today—experience automated optimization and easily boost your campaign performance.

Book a call with Dan Kremsa and learn how to automatize most of your work with Boosterberg so you can focus on more important things.